Goal 1: Advance student entry, reentry, retention, and completion strategies.
- KPI 1.3: Degree/Certificate Completion (KBOR)
- KPI 1.4: Program Completion (100%*, 150%, 200%)
|
|
|
*Displayed in KPI graphic
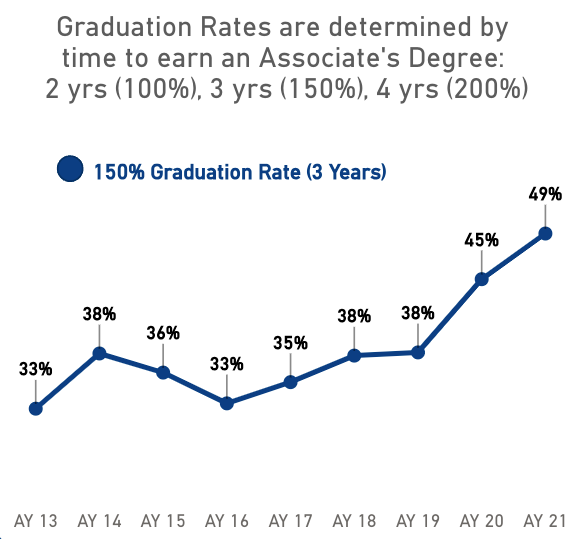
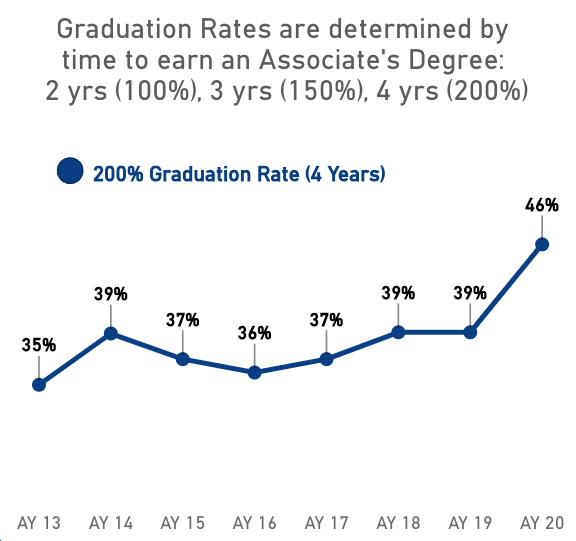
What is (100%, 150%, 200%) Program/Graduation Rate?
From KHEStats glossary. Graphics from National Center For Education Statistics (IPEDs)
Graduation rates are reported in 100 percent time, 125 percent time, 150 percent time and 200 percent time.
For the two-year institutions, the rates are for two years, three years, and four years for an associate degree while certificates are based upon the required hours for the award level.


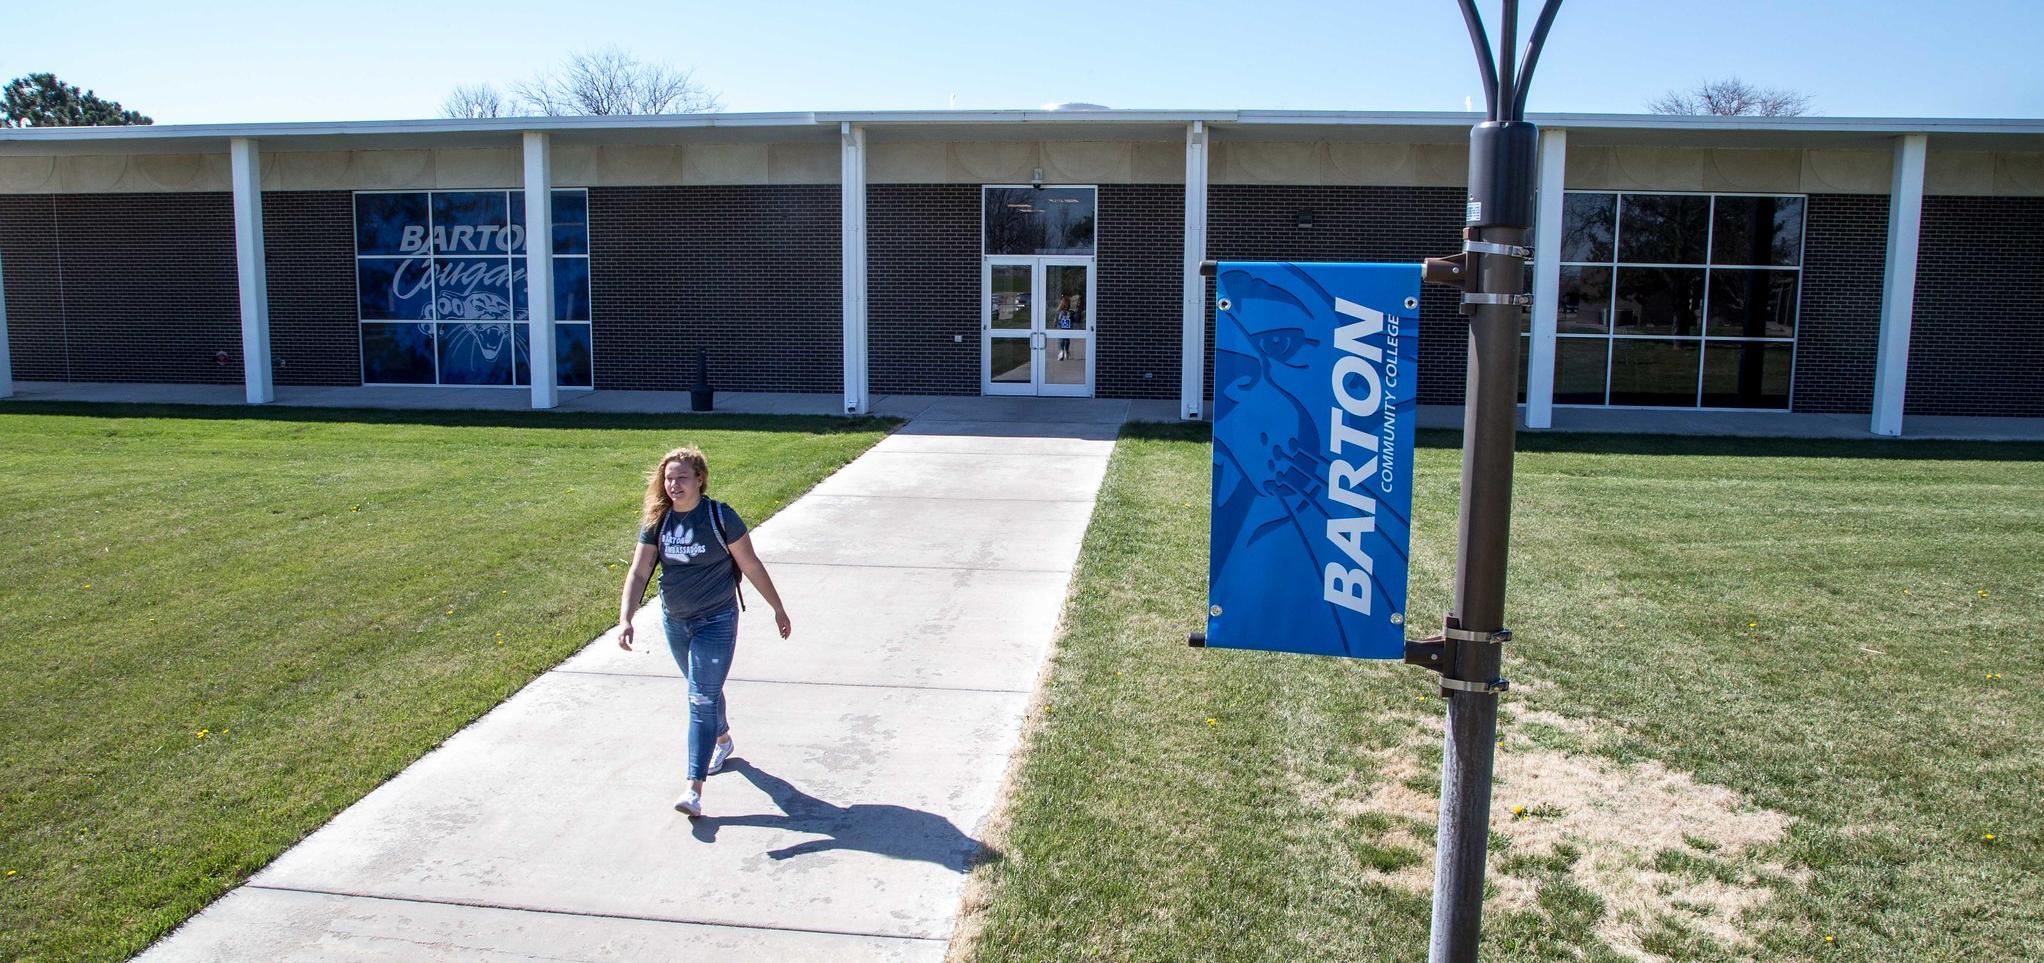
Student Success Alliance (SSA)
Barton’s newly formed Student Success Alliance (SSA), has completed a three-year environmental scan of student success at Barton Community College. As a result of its efforts and in furtherance of Barton’s Strategic Goal 1, the SSA will begin implementing the resulting Student Success Plan to support the success of students at Barton Community College through the coordination of data-driven processes across the institution.
In addition to Retention and Course Success Rate, Degree, Certificate, and Program Completion are monitored by the SSA and through Barton’s strategic goals.
Degree/Certificate Completion:
The Degree/Certificate Completion numbers reported through KPI 1.4 represent the total number of degrees and certificates awarded during the academic year. As a part of Barton’s Performance Agreements with the Kansas Board of Regents, a target baseline goal of 946 degrees or certificates completed. This goal is reviewed each month during Barton’s Programs, Topics, & Processes Team meetings and can be referenced using the KBOR Yearly Report.
Program Completion (100%, 150%, 200%):
In support of Goal 1, Barton has established a five-year goal for the completion rate of first-time students at 200% of the regular time (4 years). By AY 26-27, 42% of students will have completed their program of study within four years of the initial enrollment. This is a modest increase from Barton’s most recent completion rates reported in AY22 (40%); however, it reflects a significant increase in Barton’s average completion rates for the last five years. Further, the SSA will begin reporting on programmatic impacts on completion as a part of the Student Success Plan.
Click on the images below to view the full-size infographics!
|
|
|


For more information regarding the Student Success Alliance and their corresponding plan to support retention and completion strategies, visit: https://bartonccc.edu/students/success-academy
Back to KPI Dashboard